

")
In Part 1 of this series, we discussed the need for accurate ROAS (return on ad spend) numbers and covered first-generation attribution models. In Part 2, we examined the flaws in those models, among other challenges that stand in the way of accurate attribution. In this final instalment, we’ll look at Attribution 2.0: data-driven attribution approaches and how to solve some of the other challenges mentioned in the previous posts.
In Part 2, we saw that heuristic models are arbitrary, subject to bias, and indeed quite flawed. What we need is something that allocates credit intelligently, that’s evidence-based, and built upon a foundation of real performance data to determine the lift in value brought by each marketing touch point. Such models have been called different names – multi-touch attribution, statistical attribution, algorithmic attribution, data-driven attribution – but essentially each uses an algorithm that allocates conversion value based on data rather than heuristics. This is Attribution 2.0.
Multi-touch attribution with Shapley
Game theory is the study of mathematical models of strategic interaction among rational decision-makers, i.e., players. It has applications in social science, logic, systems science, and computer science. Cooperative game theory specifically deals with coalitions of players, how they function as a team, and their resulting collective payoffs.
In the context of digital marketing, the players of the game are touch points (channels, campaigns, ads), you employ to influence conversion. Determining each player’s worth requires measuring the marginal lift they provide in customer journeys.
 The Shapley value is a solution concept in cooperative game theory. It was named in honor of Lloyd Shapley, who introduced it in 1951 and won the Nobel Prize in Economics for it in 2012. The concept works like this: given a set of N players, subsets of players form coalitions. A coalition’s value is the total number of payoffs it generates when its players work together. The Shapley value of a player is the player’s total earned payoffs (across all the coalitions that player participated in). Essentially, the Shapley value is a measure of a player’s average marginal contribution to each coalition.
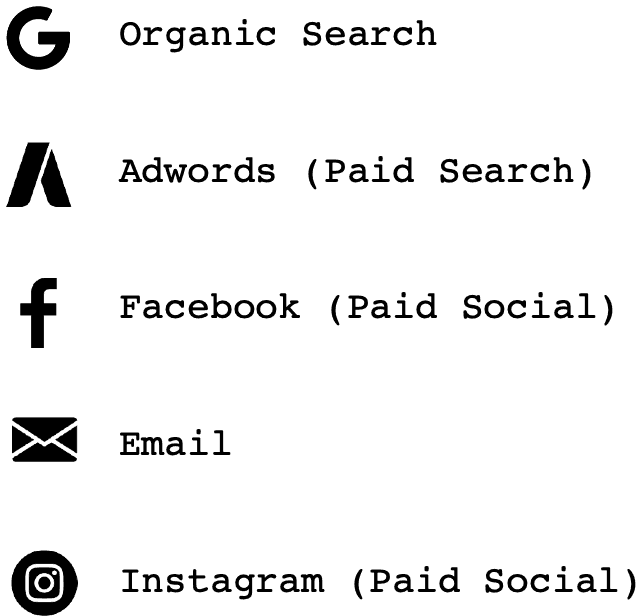
In its calculation, Shapley looks at the various coalitions players can form. In our example channels of Organic Search, AdWords, Facebook, Email and Instagram, we have 5 players that can form 5! (5 factorial) or 120 different combinations or “coalitions”. Each coalition represents a potential path to purchase.
 In the context of digital marketing, the players of the game are touch points (channels, campaigns, ads), and the various ways in which the touch points interact with customers throughout their journey form the coalitions. Cooperative game theory and the Shapley value provide a data-driven way to measure touch point influence and fairly divide the conversion credit based on each player’s individual contribution to the total payoff.
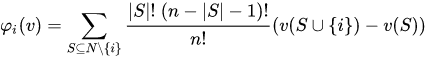
The Shapley value formula for each player i looks like this:
 Which can be interpreted as

Shapley Explained
If you find the above equation daunting, don’t worry. It’s actually quite simple, and I’ll break it down into steps. Like an average Shapley begins with a summation. The summation adds up the marginal contribution of each player across all the teams they played on. This is done by subtracting one value function from another. In our case, take Facebook. If we want to measure Facebook’s marginal contribution to a coalition, we take a coalition with Facebook and from it subtract the same coalition with the Facebook player removed. For example
(Email + Google + Facebook) - (Email + Google)Summing all such weighted marginal values for Facebook and dividing by the number of players gives us the total attributed earnings for Facebook.
The Shapley value formula has a similar feel to a weighted average, where the quantities in the summation are the marginal contributions of each player weighted by the combinations of players in coalitions. By applying the Shapley formula to each player, we get our attribution values for all three channels.
Properties of the Shapley Value
The Shapley value formula has some desirable properties that lend themselves well to marketing attribution. The first such property is marginalism. Shapley only measures the marginal contribution a player adds to the team. In our example, Facebook was rewarded credit beyond the $13900.00 it earned alone because it provided lift in the other journey where it participated.
As a consequence of the above, Shapley has a second desirable property known as the Null Player property, which states that if a player is part of a coalition but does not provide any contribution, their payoff is zero. This means that channels or touch points that simply exist on the path to purchase but don’t provide lift are not rewarded attribution credit. In real-world results, this can often be observed with Organic Search. Organic Search is often seen mid-way through a customer journey because of the way URL bars in browsers work. People frequently type a partial URL, brand, or store name into the URL bar to navigate to a site via search results. This means an Organic Search visit will be on the path to purchase if they buy, but Shapley will credit this for what it is, a null player. Organic doesn’t earn credit for just being on the team. It has to add lift.
Finally, the most important and desirable property of Shapley is that it is the only payment formula that fairly divides payoffs among the players. This can be proven mathematically; however, the proof is outside the scope of this article.
It should also be noted that the Shapley value formula is not a black box. It is a well known, transparent and accepted algorithm for solving payoff-sharing problems. More info on the Shapley Value formula can be found here.
Multi-touch attribution with Markov Chains
The other attribution 2.0 approach in widespread use is Markov chains. Markov chains is a probabilistic approach based on Bayesian statistics. Bayes’ theorem, named after 18th-century British mathematician Thomas Bayes, is a formula for determining conditional probability. Conditional probability is the likelihood of an outcome occurring, based on a previous outcome occurring. Here is a breakdown of the formula:
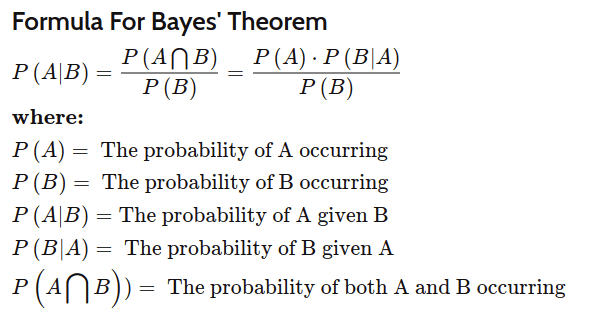 So, given prior knowledge of the probability of events A and B occurring, we can infer outcomes.
The conditional probability of A given that B has happened can be expressed as:
P(Facebook) is the probability that a Facebook ad was part of the customer journey, and P(Purchase) is the probability that a customer purchases; the conditional probability expression reads as “the probability that a Facebook ad was part of the journey given a purchase is equal to the probability that a Facebook ad was part of the customer journey AND a purchase occurred divided by the probability of a purchase”.
Markov chains (named after the Russian mathematician Andrey Markov) extend this notion of probabilistic inference by describing a sequence of possible events in which the probability of each event depends only on the state attained in the previous event. We can represent every customer journey (the sequence of channels/touch points) as a chain in a directed Markov graph, where each vertex is a possible state (channel/touch point) and the edges represent the probability of a transition between the states (including conversion.)
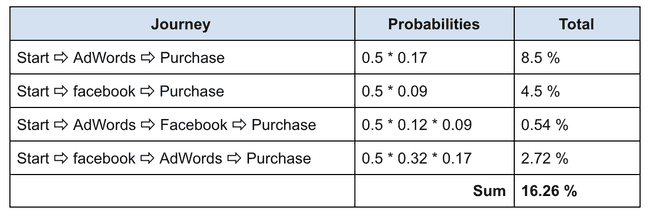
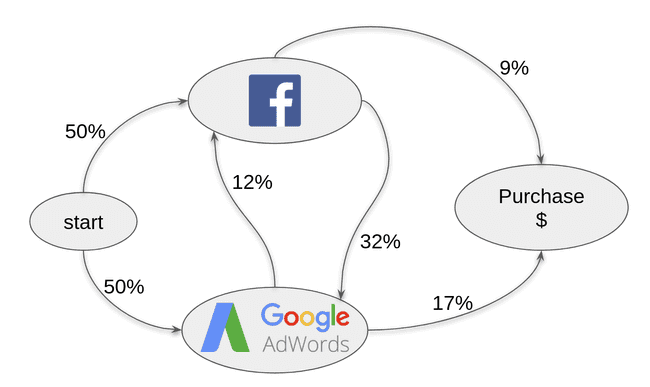 Before demonstrating how the above graph can be used for attribution, let’s look at some useful insights about the customer journey. From the example above, you can see that the path with the highest probability of success is “Start ⇨ AdWords ⇨ Purchase” with a total probability of 8.5% (0.50 * 0.17 ).
The Markov graph above also tells us the overall success rate; that is, the likelihood of a successful customer journey given the history of all journeys. The success rate is a baseline for overall marketing performance against which we can measure any future efforts or changes. The example Markov graph above has a success rate of 16.26%:
The next step is to use the above Markov graph to estimate the removal effect. We can measure a touch point’s effectiveness by removing it from the graph and simulating customer journeys to measure the change in the success rate without it. Removal Effect is a proxy for weight, and it’s calculated for each campaign in the Markov graph.
Finally, we use the removal effect to attribute each touch point value using the following formula:
Touch point attribution = Total of all sales in $ * (Touch point’s removal effect / sum of all removal effect values)
The removal effect ratio gives us a weighting for each touch point that we then use to fairly divide the total sales.
Markov vs Shapley
If you’ve been paying attention, you’ll notice that both the Shapley and Markov methods incorporate a delta measurement that compares a journey with a given touch point to the same journey with the touch point removed. Doing so essentially measures lift, allowing us to use that measurement to attribute how much credit a touch point should earn. Both approaches are evidence-based, allocating credit intelligently based upon a foundation of performance data to determine the lift in value brought about by each marketing touch point.
So, what’s the difference and how do you decide which model is right for your business? The Shapley approach is computationally expensive when your analysis is very fine-grained (at the campaign or ad level) but works great at the channel level. The advantage of Markov is that it takes into account the order of touches, whereas Shapley just looks at “players” in a coalition and doesn’t consider order. However, Markov can overvalue channels when journeys become long and complex. With Shapley, channels with zero impact are not rewarded, so it’s the best model for computing fair attribution.
In practice, both models produce similar results. At Trialfire, we use Shapley and overcome computational challenges using Shapley approximation techniques.
In the end, the attribution model is only part of the story. Data quality, a complete customer journey, and centralizing ad-costs data are the other 3 pillars that support a successful ROAS strategy, not to mention the changes in corporate mindset needed to bring about such a strategy.
The Attribution 2.0 Advantage
A holistic view of digital marketing performance
Siloed marketing performance data is arguably the biggest issue facing marketers today. The plethora of different platforms and tools, each with its own reporting functionality, results in a myriad of problems when attempting to accurately account for return on ad spend. Competing channels often take credit for the same sale, use different attribution models with different lookback periods, and report ROAS metrics that never reconcile with actual sales.
The customer journey, although composed of different touch points, must be measured holistically to see exactly which channels are influencing sales and by how much. Accurate data supports better, more confident data-driven marketing decisions.
Allocate Budgets Effectively
Eliminate the guessing game of allocating budget to the right channels and tactics to drive sales, revenue, and other outcomes. Clear and concise insight into the customer’s path to purchase allows marketers to invest wisely in the right mix of channels. By integrating spend data with sales and journey analytics, multi-touch attribution addresses Wannamaker’s dilemma and gives marketers their true return on ad spend, minimizing wasted digital marketing investments.
Prove the Value of your Campaigns
Today’s savvy digital marketer knows that anywhere between a few to a dozen marketing touches are needed for a customer to convert. Efforts spent upstream on awareness, audience growth, and building mindshare pay dividends downstream with increased customer interest and conversions. Without multi-touch attribution, the downstream causal relationships between channels and tactics can be murky, making it difficult for marketers to justify their efforts. In a bid for self-preservation, they tend to rely on vanity metrics. The Shapley value formula approach to attribution specifically measures these causal relationships and elucidates the impact of spend anywhere in the sales funnel.
Remove Bias
We are all subject to bias. Everything from confirmation bias to self-serving bias shapes our decisions. By collecting and presenting data to defend opposing views or support your original decisions, bias can be mitigated. Biases also exist in the platforms, tools, or agencies we employ to execute digital campaigns. An all-encompassing attribution solution holds each of these to account and examines results impartially.
Conclusion
For a time, simplistic, easy-to-use attribution models were enough. With the emergence of new platforms, marketers began to employ a multitude of tactics to take advantage of new technology. Customer journeys began to get more complex and less predictable. The de facto attribution models couldn’t keep up and more likely than not presented inaccurate data on the performance of campaigns. Shapley and Markov multi-touch attribution both address these challenges and give marketers accurate ROAS metrics. However, the real challenge is still organizational and cultural. Teams need to be aligned around a singular customer journey. Each marketing channel should be thought of as a means to an end, not the end itself. This way, companies can build and measure the success of their marketing even when it’s built on the shifting sands of news platforms, technologies, and tactics.
